Quickstart Guide: Elastic Stack for Devs
This guide will step you through getting a basic Elastic Stack up and running with data in just a few minutes. This environment won't be secured or tuned for production, but it's a great place to start.
About the Elastic Stack
Elasticsearch is an open-source, scalable, full-text search and analytics engine. It is used for a variety of purposes, from Full Text Search, to E-Commerce, to Real-Time Analytics. It is frequently associated with big organizations and big data, but Elastic did a great job with their default configurations so it's easy for smaller projects as well.
In this guide, we're going to spin up a basic Elastic Stack (formerly known as the "ELK Stack") that brings together a few different open-source services that were designed to work together. Here is a high level description of those services:
Elasticsearch is a persistence engine and API layer.
Logstash is a plugin-based tool for importing data
Kibana is an administration GUI for exploration and management
Prerequisites
You need Docker for this guide, check here for installation instructions.
If your are on Windows, then I recommend using the Linux containers (default) and also sharing a drive so that Docker can persist your Elastic data to disk.
#1: Compose the architecture
The first step is to create a docker-compose.yml file that describes how your services fit together. I'm aiming for speed over depth in this guide so I have already created this for you.
Simply clone the repository and fire up the Elastic Stack:
git clone https://github.com/codingblocks/simplified-elastic-stack.git
cd simplified-elastic-stack
docker-compose up -d
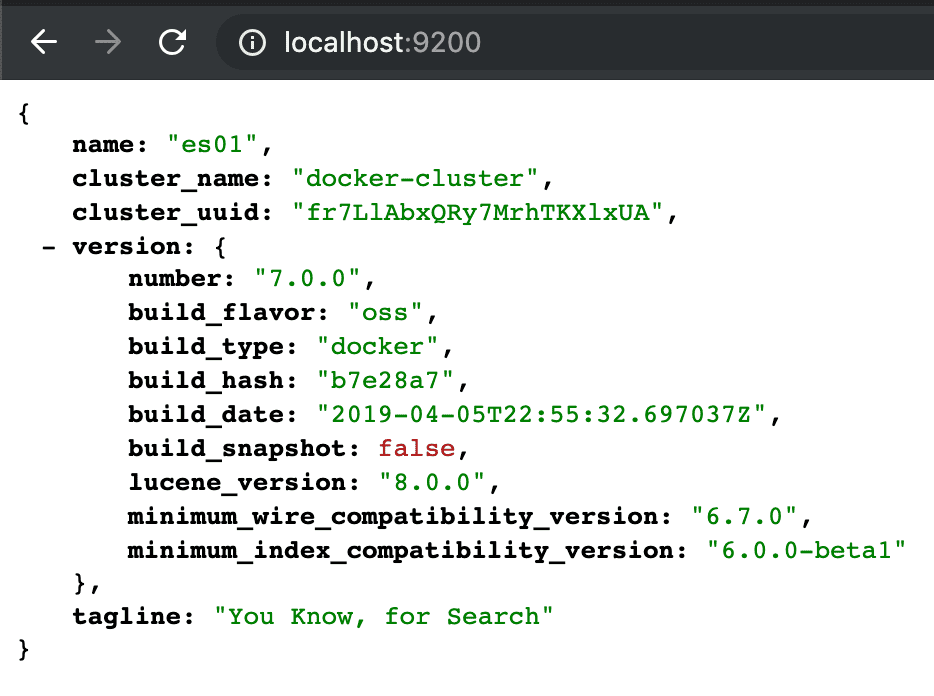
Give Elasticsearch a few seconds to catch it's breath after it starts up and then you can verify it's status by hitting this url a browser: https://localhost:9200
#2: Import data
Now we'll use Logstash to import data. The repo you cloned above already has a custom Dockerfile.Logstash file, so lets add an input plugin that can import RSS feeds. All you have to do is add the second line to Dockerfile.Logstash so that it looks like this:
FROM docker.elastic.co/logstash/logstash-oss:7.0.0
RUN bin/logstash-plugin install logstash-input-rss
Now let's add a couple input configurations. Each "input" block represents one RSS feed that will be imported into Elasticsearch every 3600 seconds. Replace the config/logstash.conf file contents with the following lines and Logstash will take care of the rest.
You can see the inputs are some of my favorite blogs, configured to poll once an hour. The output sets up a basic index called "blogs" that will hold the data.
Expand for config/logstash.conf
input {
  rss {
    url => https://dev.to/feed/davefollett
    interval => 3600
  }
  rss {
    url => https://dev.to/feed/dance2die
    interval => 3600
  }
  rss {
    url => https://dev.to/feed/kritner
    interval => 3600
  }
  rss {
    url => https://dev.to/feed/molly_struve
    interval => 3600
  }
  rss {
    url => https://dev.to/feed/rionmonster
    interval => 3600
  }
  rss {
    url => https://dev.to/feed/TheInfraDev
    interval => 3600
  }
  rss {
    url => https://dev.to/feed/thejoezack
    interval => 3600
  }
}

output {
  elasticsearch {
    action => "index"
    index => "blogs"
    hosts => "elasticsearch:9200"
    document_id => "%{[link]}"
  }
}
That's it, Logstash will take care of everything else. Next time we restart our environment, Logstash will start polling and importing the feed data.
Stop, re-build, and restart your environment:
docker-compose down
docker-compose build
docker-compose up -d
Give Elasticsearch a minute to breathe after docker-compose is running, and try hitting this url in the browser to see that you have data: http://localhost:9200/blogs/_search
#3: Have fun!
Everything is setup now, so it's time for you to do a bit of exploring.
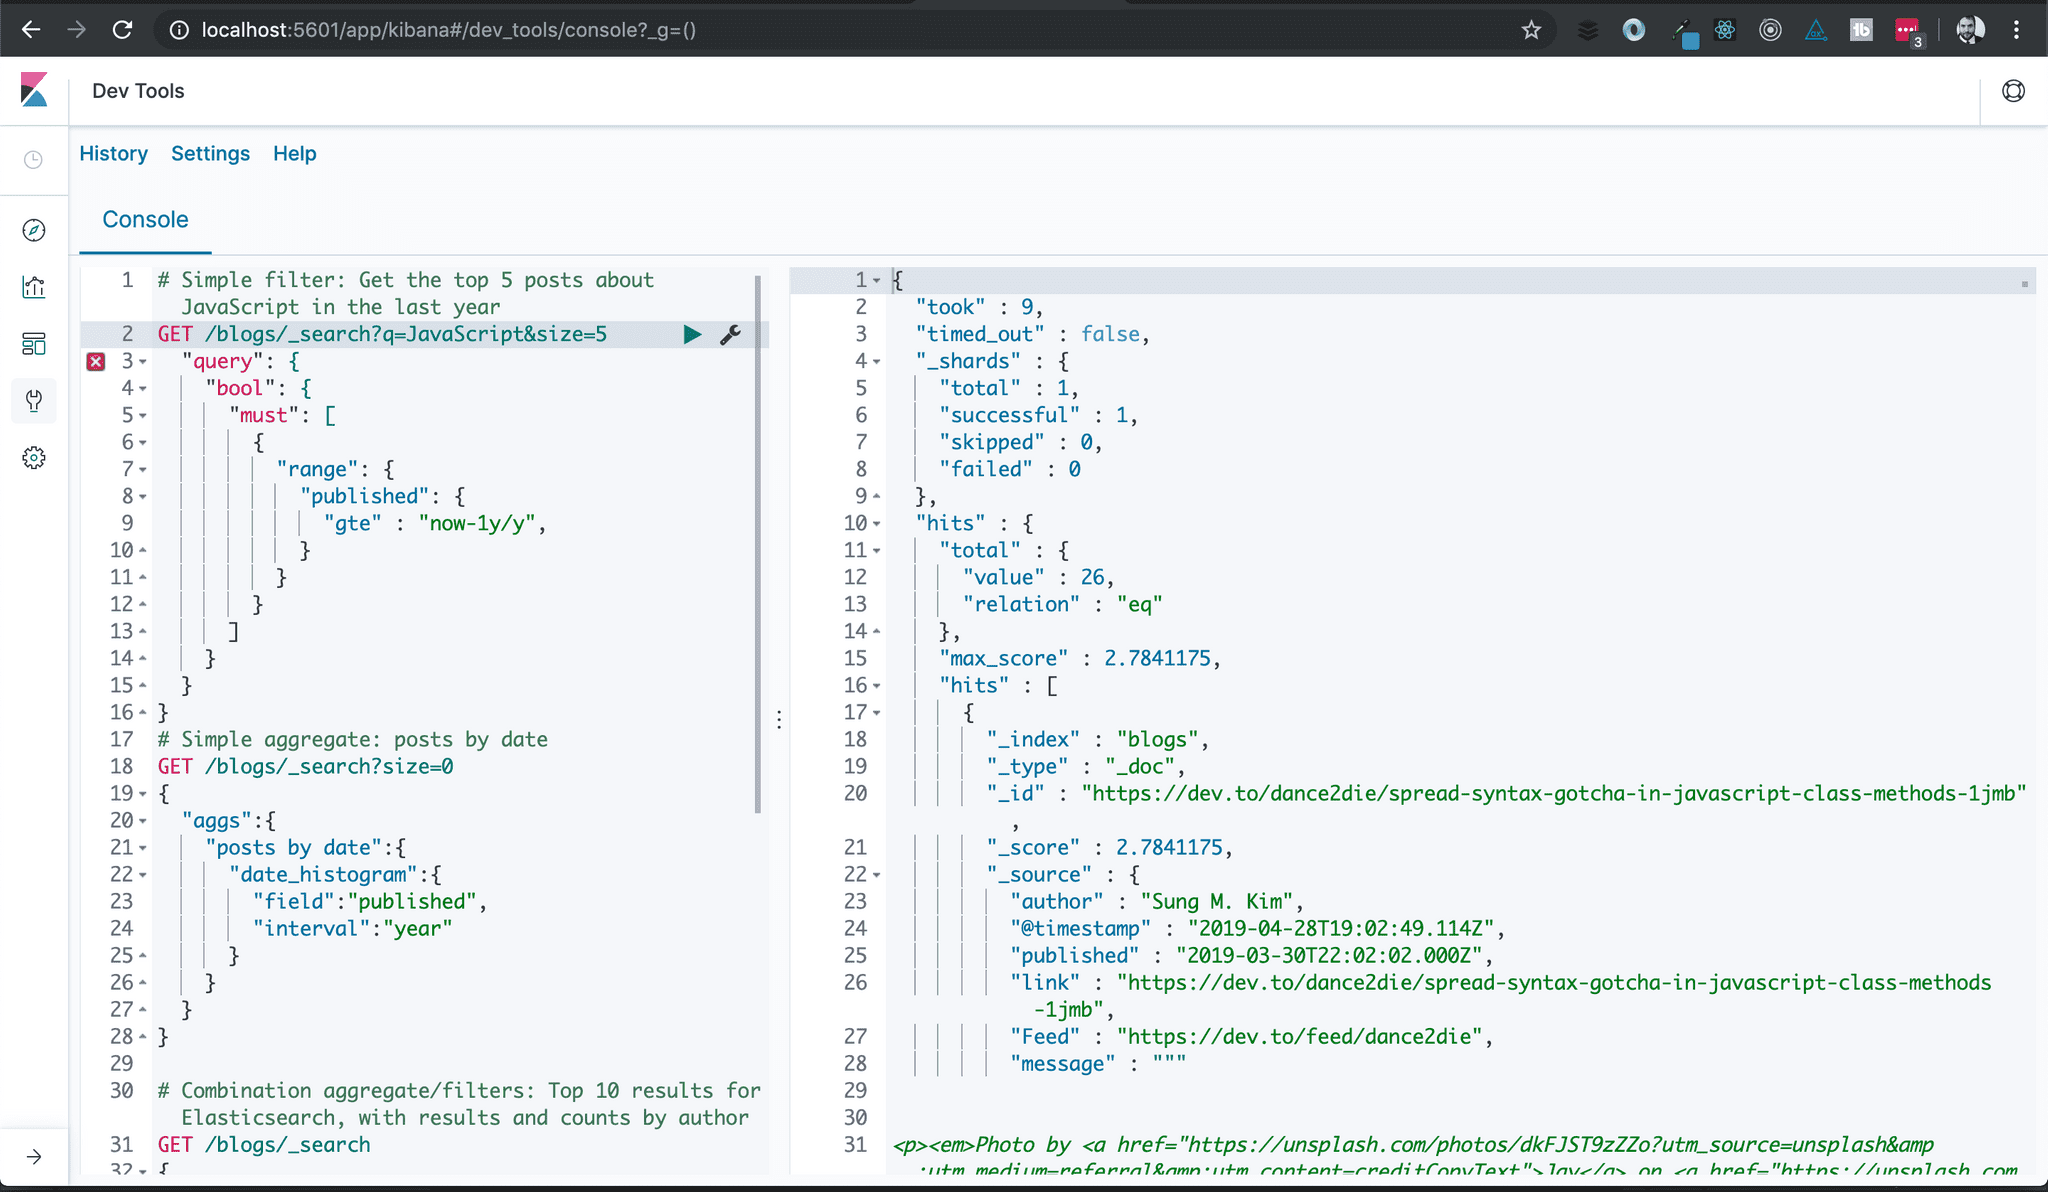
If you are new to the Elastic Stack, I recommend getting acquainted with Kibana first. It's already running on your computer: http://localhost:5601
Head over to the "dev tools" and give a few of these queries a shot so you can get a taste of what Elastic has to offer.
Sample queries
Simple filter, top 5 posts about JavaScript in the last year
GET /blogs/_search?q=JavaScript&size=5
  "query": {
    "bool": {
      "must": \[
        {
          "range": {
            "published": {
              "gte" : "now-1y/y",
            }
          }
        }
      ]
    }
  }
}
Simple aggregate, posts by date
GET /blogs/_search?size=0
{
  "aggs":{
    "posts by date":{
      "date_histogram":{
        "field":"published",
        "interval":"year"
      }
    }
  }
}
Combination aggregate/filters: Top 10 results for Elasticsearch, with results and counts by author
GET /blogs/_search
{
  "query": {
    "bool": {
      "must": \[
        {
          "match": {
            "message": "Elasticsearch"
          }
        }
      ]
    }
  },
  "aggs": {
    "author": {
      "terms": {
        "field": "author.keyword"
      }
    }
  }
}
Here are a couple suggestions for what to do now that you've got Elastic Stack up and running
- Build a simple website that lets you browse and search for your favorite blogs.
- Explore the Search and Aggregations APIs
- Create visualizations with Kibana
Troubleshooting: (Huge thanks to Dave Follett for the help!)
- Running on linux, and the Elasticsearch container keeps crashing? Your vm.maxmapcount might be too low. Check this out for an explanation / fix: https://www.elastic.co/guide/en/elasticsearch/reference/current/vm-max-map-count.html
- Having trouble with containers? "docker logs" and "docker inspect" are your friends. You can run a command like this in order to see where all the elasticsearch files are on disk: "docker inspect $(docker ps -f name=elasticsearch -aq)"


